Get a quick overview of your business with the Okappy Dashboard
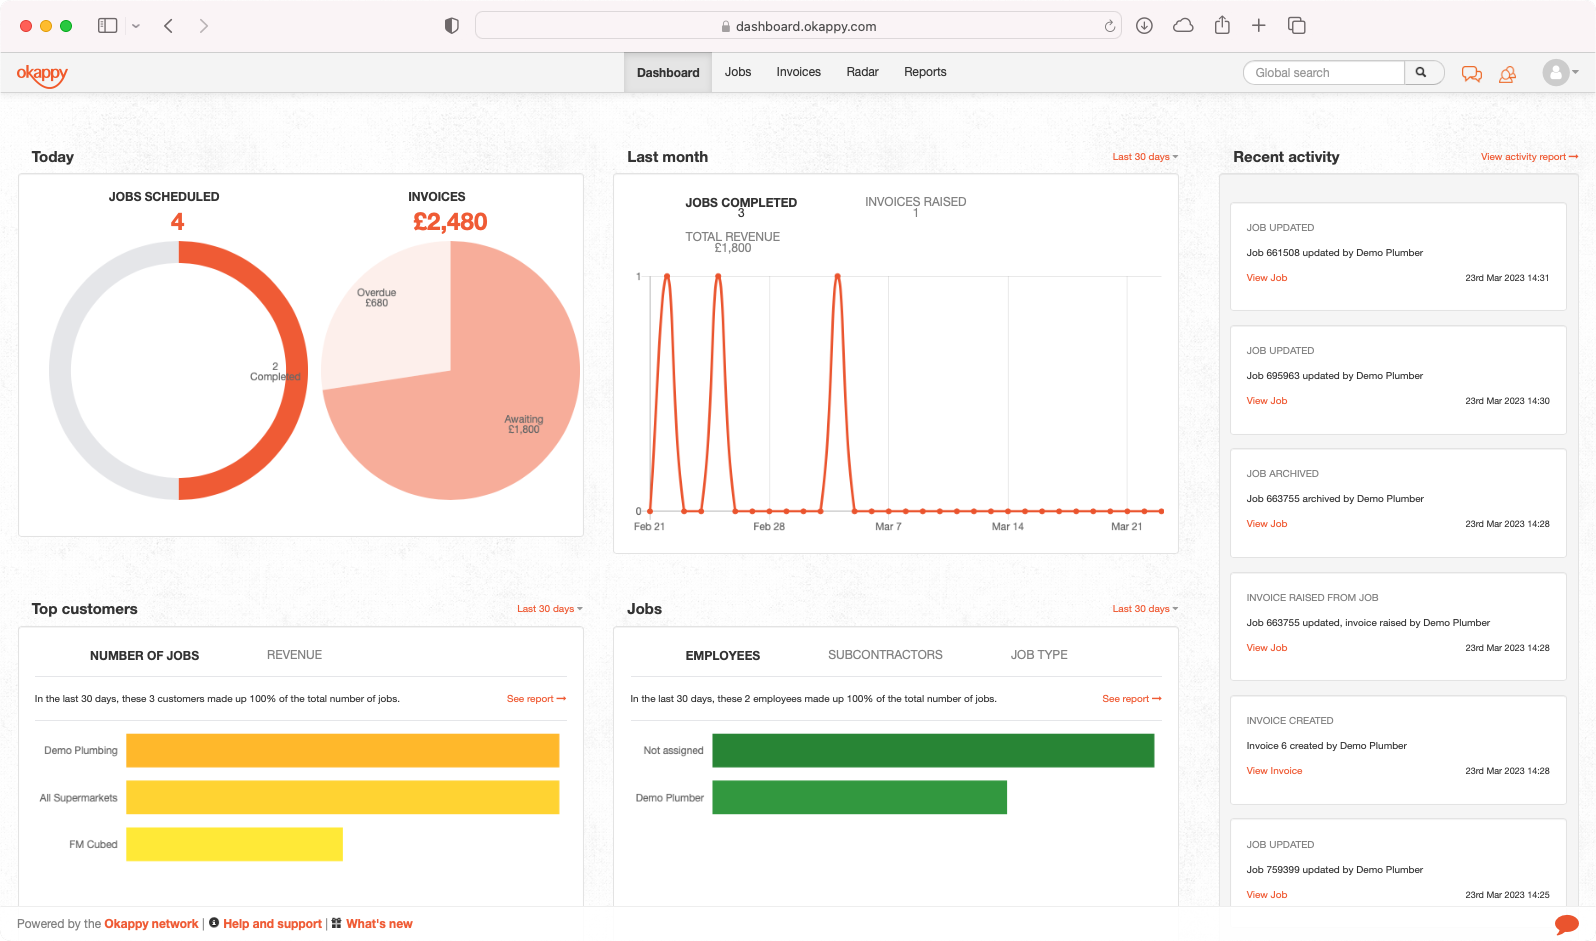
The Okappy dashboard provides a quick overview of what is happening in your business. It shows key statistics around the jobs you’ve created and the invoices you’ve raised. You can also see the latest activity updated in real time as jobs and invoices are updated within your business.
Read on to see how to view the dashboard along with more details about what information is available.
Viewing your dashboard
The dashboard is available from the Dashboard link at the top of the page when logged in on the web.
If the tab is not showing, you can enable it by clicking on your profile icon towards the top right of the screen, selecting System Systems and then ensuring the Dashboard checkbox is ticked.
Note: The dashboard is not available for all account types. If the option is not available please upgrade your account first.
What does the different sections of the dashboard show
Jobs today

The Today section shows all the jobs which have been added on to the system today. It also shows the current invoices which are in draft status, awaiting payment status and/or overdue.
Last month
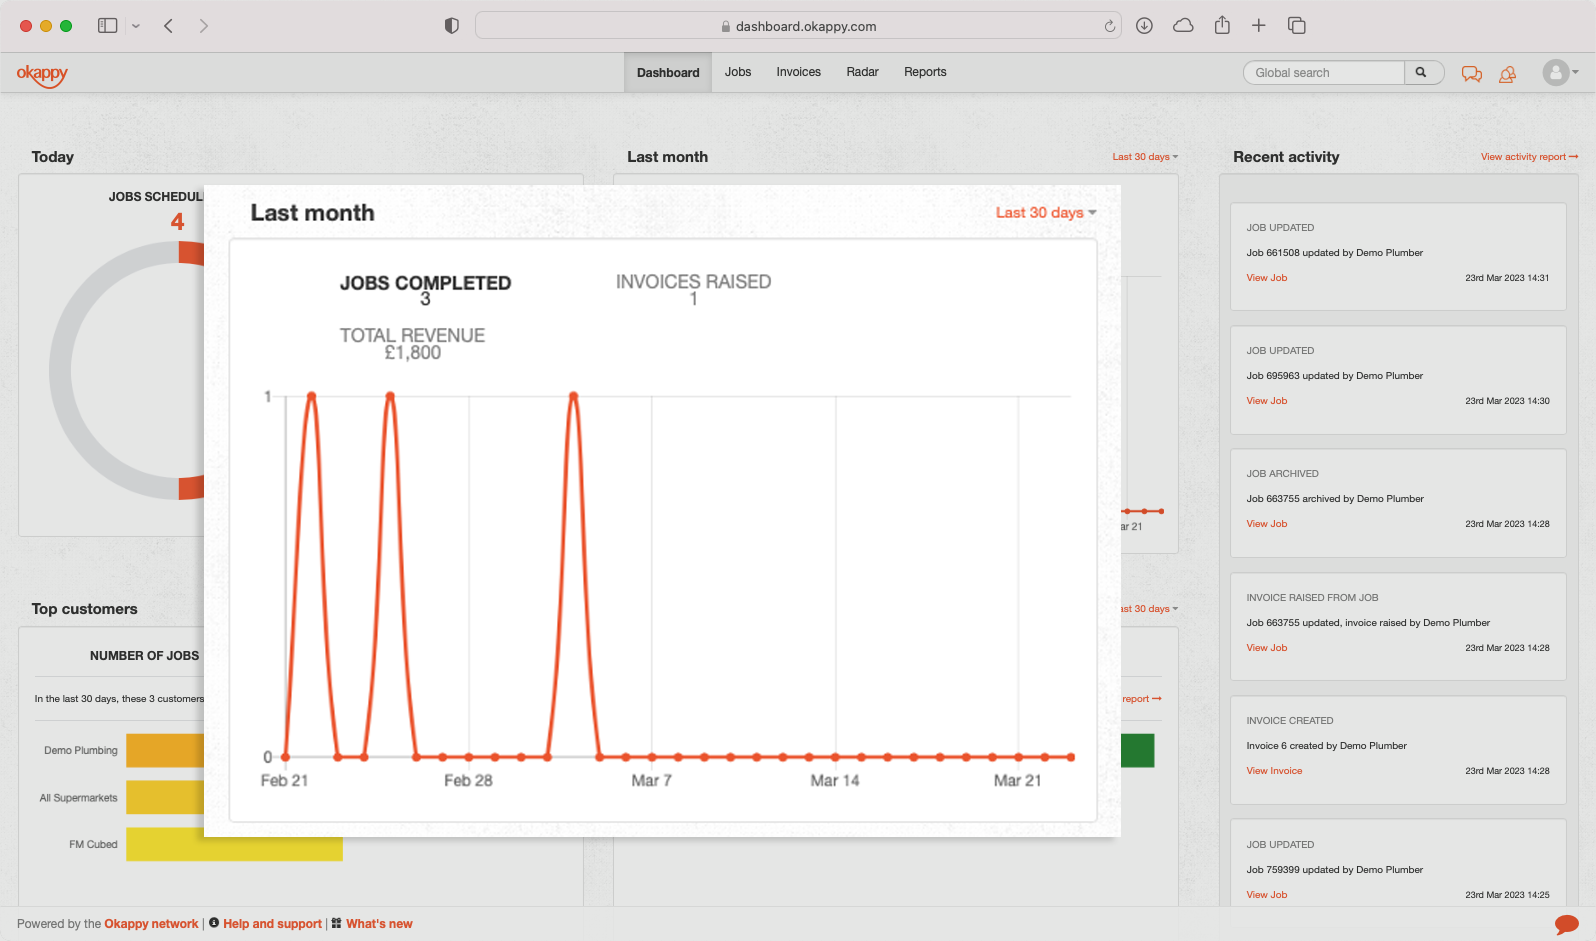
The Last month section shows the number of jobs which have been created over the period, the total value of invoices raised and the number of invoices raised.
Clicking on Jobs, Total Revenue and Invoices raised shows a graph for each over the period.
Top customers
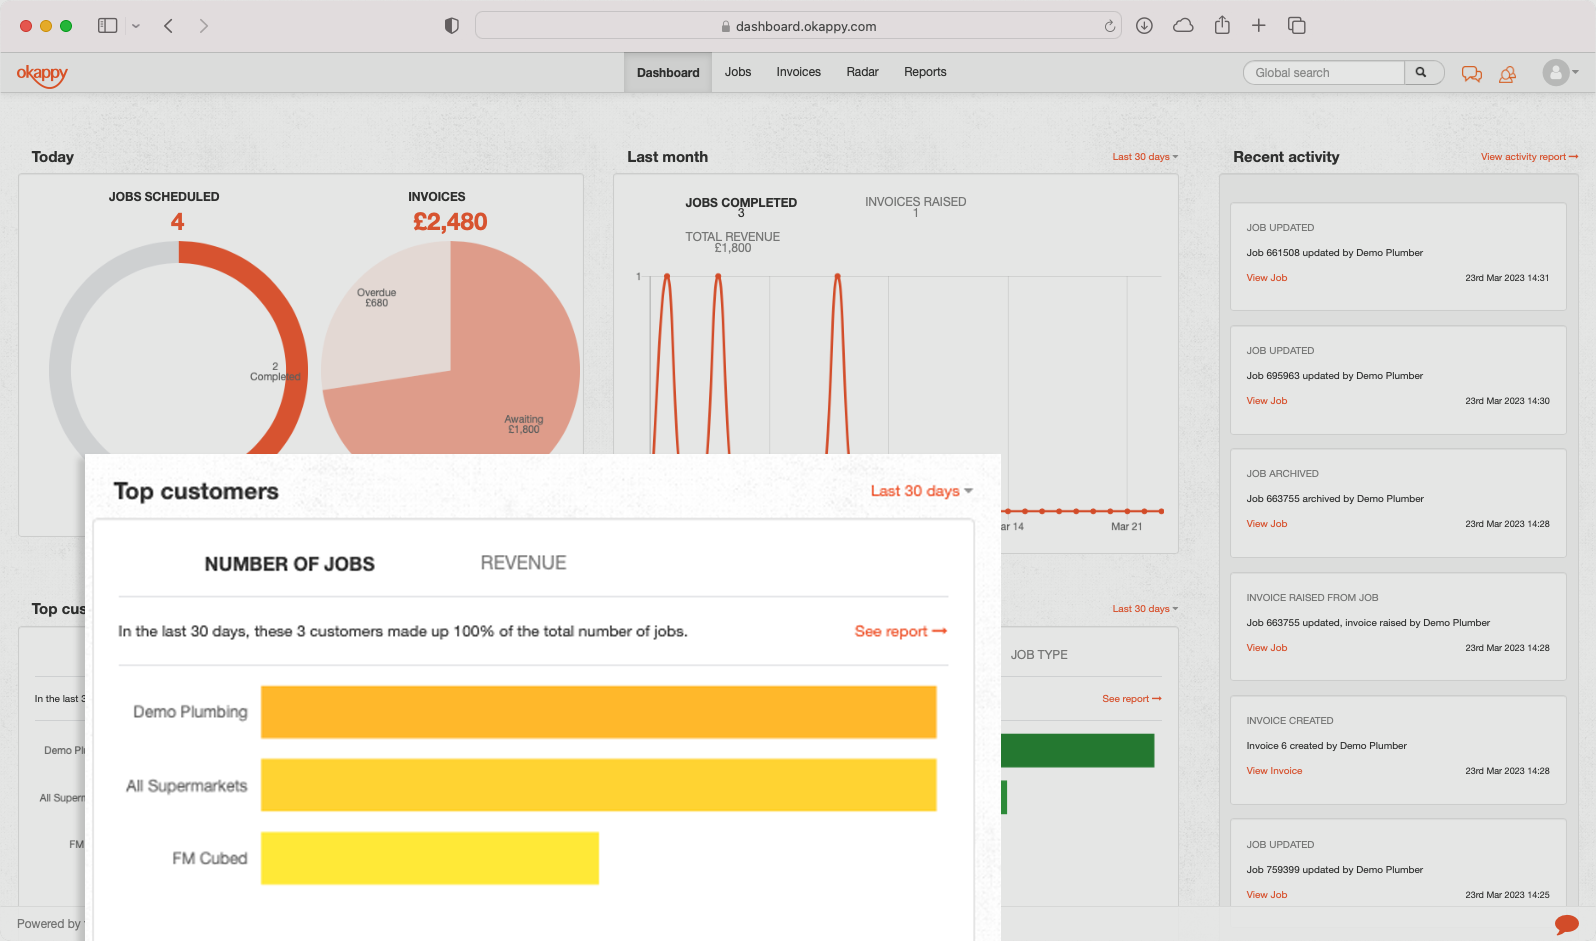
The Top Customers section shows the top customers by number of jobs done for that customer or by the value of invoices raised to that customer. You can change the time period for the report and view the underlying details of the report by clicking the relevant link.
Jobs
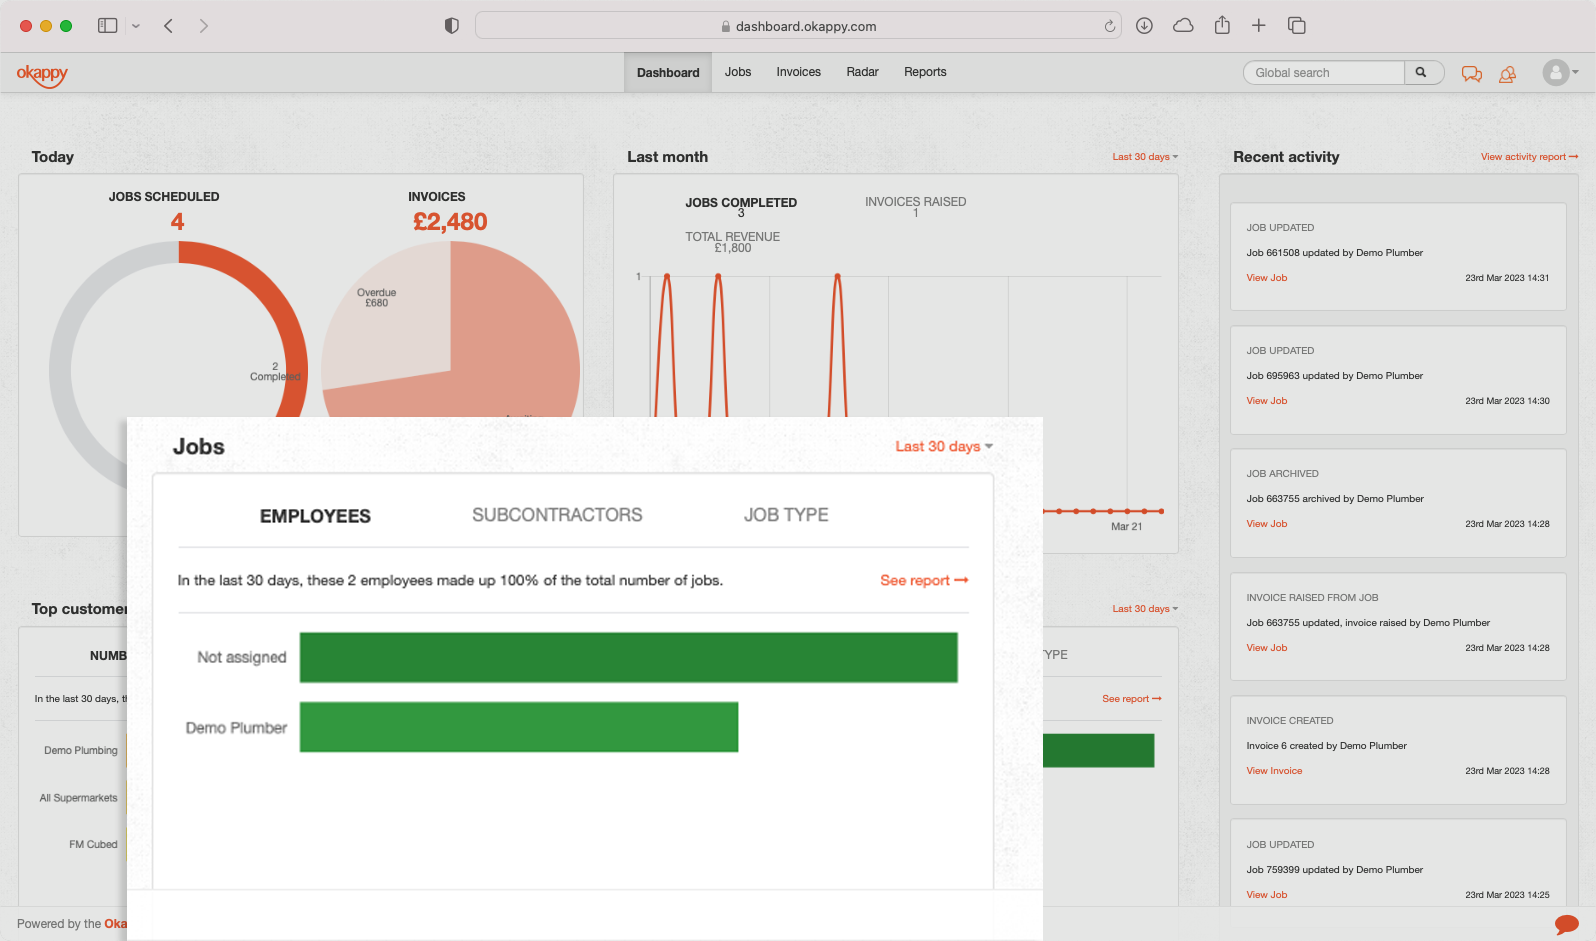
The Jobs section shows the number of jobs done for each employee or subcontractor over a period. It also shows the number of each type of job over the same period.
To change the period click the link towards the top right of the section. You can also see the underlying data for the report by clicking on the See report link.
Recent activity
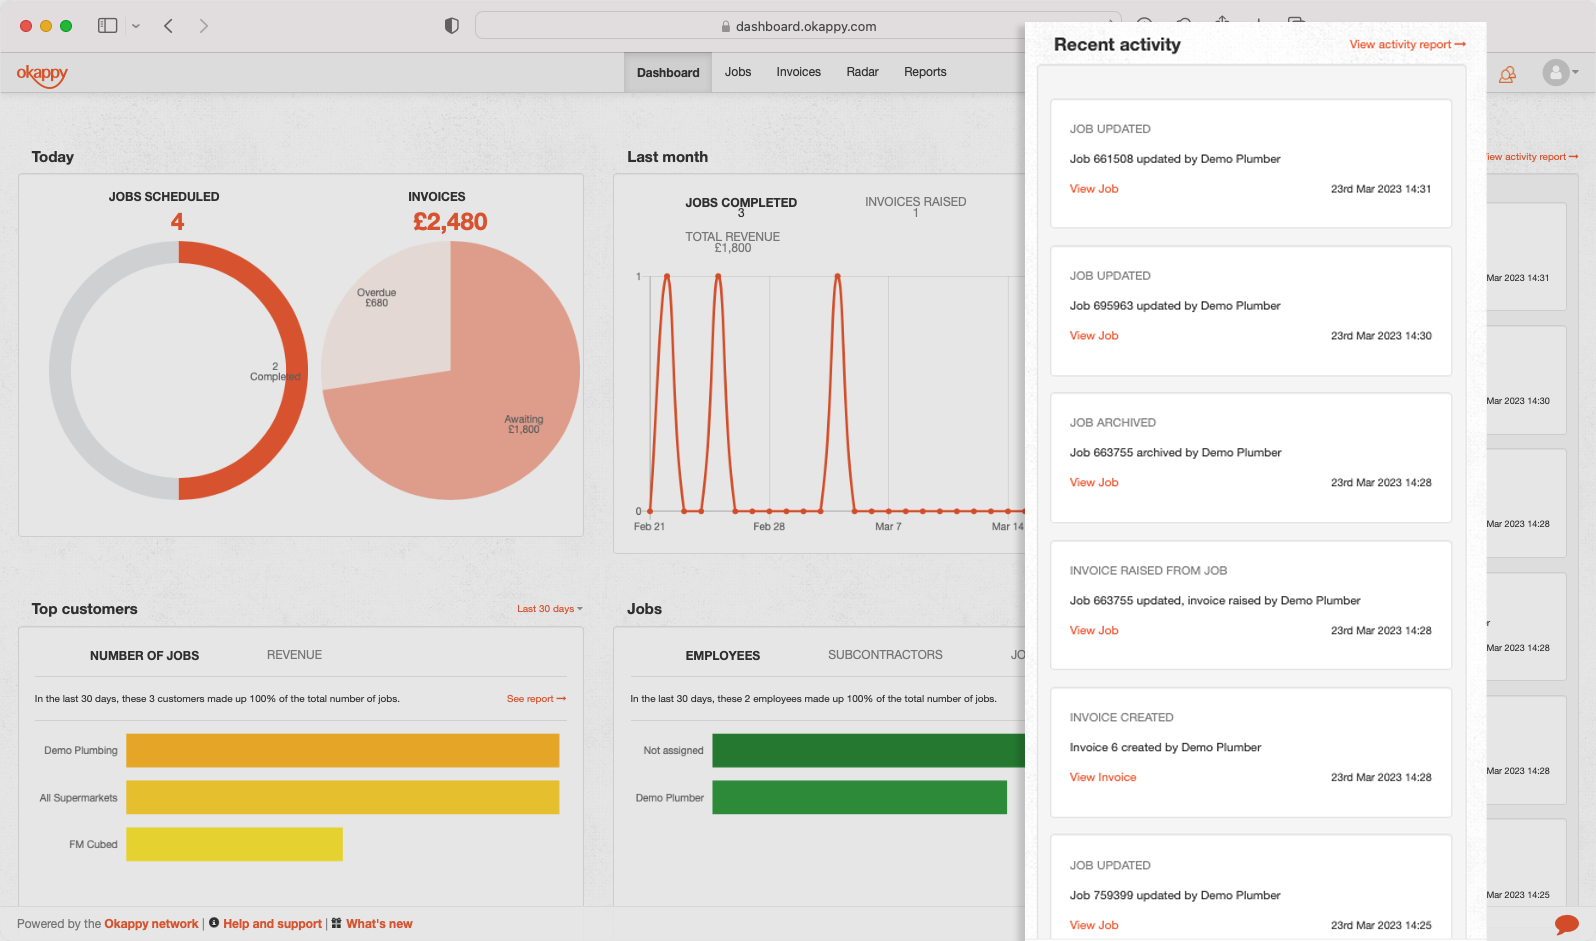
The Recent activity section shows all the job and invoices updates done today.
To see activity over a different period, click the See activity report link.
See also
You can also create dashboards using Google Sheets or Microsoft 365. See Overview – creating dashboards for more information.
For additional reports, see
